Error Management
Error Management
In a complex software environment, with literally 100,000+ jobs running in the enterprise, it is extremely difficult to manage the failures and also understand the statistics. There are jobs that run at regular frequency till job completion. And some jobs run at regular frequency but expected to run for a pre-defined time. And also once has to capture the pipeline of the job flow.
To handle this complexity of error management, and help IT with better management. We designed a system that with two simple API’s could capture all the data we needed.
Here below are the simplest REST API definition for error management. The first API is called before any script or job starts in our system.
POST /api/error-mgmt
{
    "job_identifier": "0-A02344598-0",
    "start_time": "2016-06-10 10:00:00",
    "pipeline": "0",
    "software_identifier": "name-1.1.0",
    "frequency": "60",
    "server_ip" : "x.x.x.x"
}

If request served successfully you will receive json with success = 1 on error api will return success = 0 as following

// Success Response

{
  "success": "1"
}

// Error Response
{
  "success": "0",
  "message": "Invalid request"
}

The second script below will be run after the script or service is executed as below:
POST /api/reports
{
"job_identifier": "0-A02344598-0",
"end_time": "2015-06-10 10:03:00",
"job_status": "SUCCESS",
"error_code": "",
"additional_info": ""
}
If request served successfully you will receive json with success = 1 on error api will return success = 0 as following
// Success Response
{
"success": "1"
}
// Error Response
{
"success": "0",
"message": "Invalid request"
}
Interestingly, you can make the Error API as rich as can be by adding data
statistics parameters or potentially performance parameters of memory, cpu,
and network traffic.
Since the above data is captured in a database, we have built a dashboard of
jobs and errors. And we also have built the ability to aggregate errors,
and notification can be sent based on predefined threshold. For example,
non-critical jobs can have threshold of 5%. This means that the system can
tolerate 5% of the errors. If the job is super critical, the threshold can be
zero.
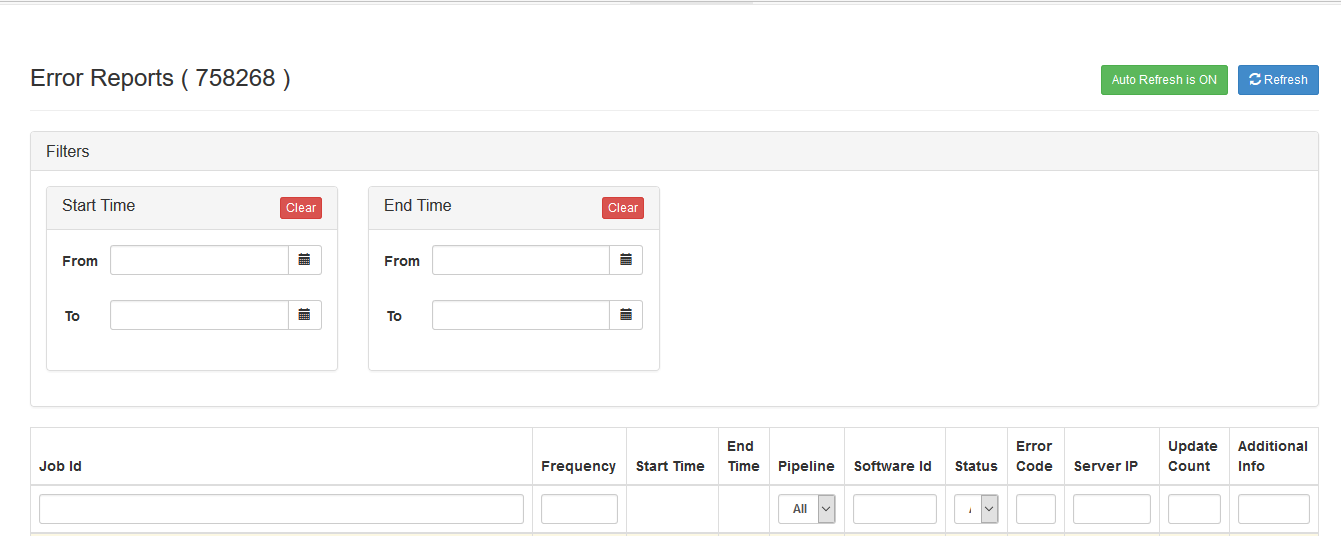
Here below is an example of Error Dashboard that was built with this simple API.
 In addition, we publish statistics of all the jobs hourly or daily. This is
extremely valuable for managing the infrastructure.
In addition, we publish statistics of all the jobs hourly or daily. This is
extremely valuable for managing the infrastructure.
Moogilu not only builds software products but also does the hosting. And this is a valuable tool for managing jobs when the job exceeds a few hundreds. We currently run 100,000 – 250,000 jobs/day.